
TEAM SESSION ANALYSIS
-
0.00 navigate to session analysis
-
0.09 select session and participants
-
0.15 filter by whole session or specific drills
-
0.21 view data in table format
-
0.26 switch to bar or bubble charts
-
0.32 select advanced metrics
-
0.38 toggle data labels
-
0.44 sort data and view percentages
-
0.52 understand dynamic color-coding
-
1.06 customize chart color palettes
-
1.20 download PDF or CSV reports
-
1.30 attach files and videos
INDIVIDUAL PLAYER ANALYSIS
-
0.00 access the individual analysis section
-
0.08 view the radar chart
-
0.16 check advanced metrics
-
0.20 review the session summary
-
0.29 analyze the drill breakdown
-
0.37 change players, sessions, and metrics
-
0.46 customize view and download reports
PERIOD TOTAL ANALYSIS
-
0.00 access period total analysis
-
0.08 set the date range
-
0.30 toggle labels and sort data
-
0.40 expand graph or export data
PERIOD TREND ANALYSIS
-
0.00 access period trend analysis
-
0.10 select dates and players to view daily totals
-
0.18 view dual-format charts for metric comparison
FEATURE DESCRIPTION
The Session Analysis module provides a powerful suite of tools for evaluating physical data. By transforming raw metrics into visual charts and comparative reports, staff can monitor team workloads, individual player responses, and long-term performance trends relative to competitive benchmarks.
Team Session Analysis
The Team Area allows you to evaluate the collective performance of the squad or specific groups for any given training session or match.
-
Select Data Scope: Choose the specific session and the participants you wish to visualize.
-
Define Analysis Depth: Use the Split dropdown menu to toggle between analyzing the session as a whole or breaking the data down drill-by-drill.
-
Choose Visualization Style:
-
Table View: Provides a comprehensive list of all active metrics.
-
Charts: Use the Bar or Bubble charts to focus on one or two specific metrics simultaneously.
-
-
Enable Advanced Metrics: Select the dropdown menu to calculate and display complex performance indicators. Note that this type of analysis are available ONLY for the Default metrics (the ones marked with the *)

Furthermore, by using the buttons in the top-right corner, you can customize your analysis:
-
Configure Data Labels: Click the Show Data Labels icon to display exact numerical values directly on the chart.

-
You have the ability to order the column in ascending order, by clicking on the correspondent icon

-
If you click on the percentage icon (GD values %), you will see a comparison in percentage values between the current training session and the game day. thresholds.

-
The system utilizes a dynamic color-coding logic to compare current data against personalized Game Day (GD) thresholds:
-
Gray: Far below threshold.
-
Yellow: Approaching threshold.
-
Green: Target reached.
-
Orange: Moderately above threshold.
-
Red: Significantly beyond threshold.
-

-
You can customize these visuals via the Color Palettes (Colorful, Monochromatic, or Accessible) or by creating a custom theme to set specific colors for every value.

Integrated Tools and Documentation
Throughout all analysis sections, several utility icons remain available to streamline your documentation process:
-
File Repository: Click to attach or access documents and files specific to the session.
-
Video Icon: Attach or view related video footage.
-
Planning Redirect: Click to jump directly to the corresponding session card in the calendar.
-
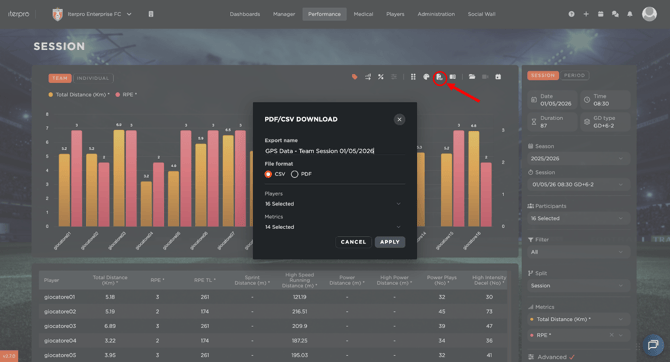
Download Icon: Export the current screen’s data and charts as a formatted PDF or a raw CSV file. In here:
- Edit the Export Name.
- Choose the File Format, between CSV or PDF.
- Select the Players and Metrics you want to include in the file.
- Click Apply.
Individual Player Analysis
The Individual section focuses on a single athlete, providing a high-detail comparison between their current performance and their historical averages.
-
Radar Chart Overview: Located in the top left, this chart provides an immediate visual of active metrics compared to the player's Game Day thresholds.
-
Review Advanced Metrics: Find the detailed breakdown of calculated indicators directly below the Radar Chart.
-
Analyze the Session Summary: On the right side of the screen, view how current values compare to the player's Game Day averages through both raw numerical data and percentage-based visualizations.
-
Evaluate Drill Distribution: Use the Drill Breakdown at the bottom to see how physical or technical load was distributed across the specific segments of the session.

Period Total (Cumulative) Analysis
The Period Total section is used to analyze aggregate work performed over a specific timeframe, such as a microcycle or a full month.
-
Define Date Range: Select the start and end dates for the analysis. The table will automatically populate with aggregate data for all sessions within that period, organized by player.
- Select the splits: choose the spits you want to include in the calculation. For example, only the training split, or only the data included in a specific drill.
-
Visualize Aggregates: Select one or two metrics to generate a chart representing the cumulative totals.
-
Contextualize with Benchmarks: Toggle the view to show results as a Percentage of Game Day values to understand the total load relative to match demands.
-
Export and Expand: Use the Expand icon for a full-screen view of the graph, or click the download button to export the aggregate data as a PDF or CSV.

Period Trend Analysis
The Period Trend section tracks player development and load progression chronologically, allowing you to monitor how performance evolves over time.
-
Set Parameters: Define the date range and select the players you wish to track. The table will display daily totals for every session in that period.
-
Compare Dual Metrics: The chart utilizes a dual-format visualization:
-
Primary Metric: Displayed as vertical bars.
-
Secondary Metric: Overlaid as a line graph to identify correlations between different data points.
-
-
Customize and Export: As with other sections, you can toggle data labels, change color palettes, and export the trend analysis to PDF or CSV for external reporting.
